| 目录: 28288 |
| 产品名称: BCMA(DM4) Rabbit Monoclonal Antibody |
| 基因符号: TNFRSF17 |
| 描述: BCMA antibody(DM4) Rabbit Monoclonal Antibody |
| 背景: The protein encoded by this gene is a member of the TNF-receptor superfamily. This receptor is preferentially expressed in mature B lymphocytes; and may be important for B cell development and autoimmune response. This receptor has been shown to specifically bind to the tumor necrosis factor (ligand) superfamily; member 13b (TNFSF13B:TALL-1:BAFF); and to lead to NF-kappaB and MAPK8:JNK activation. This receptor also binds to various TRAF family members; and thus may transduce signals for cell survival and proliferation. [provided by RefSeq; Jul 2008] |
| 经过测试的应用: ELISA; Flow Cyt; IF; IP |
| 推荐稀释度: Flow Cyt 1:100; IP 1:30 |
| 种属反应性: Rabbit |
| 亚型: Rabbit IgG |
| 纯化: Purified from cell culture supernatant by affinity chromatography |
| 种属反应性: Human BCMA |
| 成分: Lyophilized from sterile PBS, pH 7.4. 5 % – 8% trehalose is added as protectants before lyophilization. |
| 储存和运输: Store at -20°C to -80°C for 12 months in lyophilized form. After reconstitution, if not intended for use within a month, aliquot and store at -80°C (Avoid repeated freezing and thawing). |
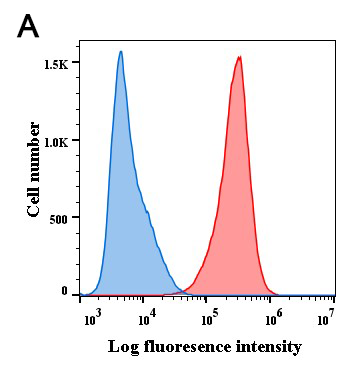 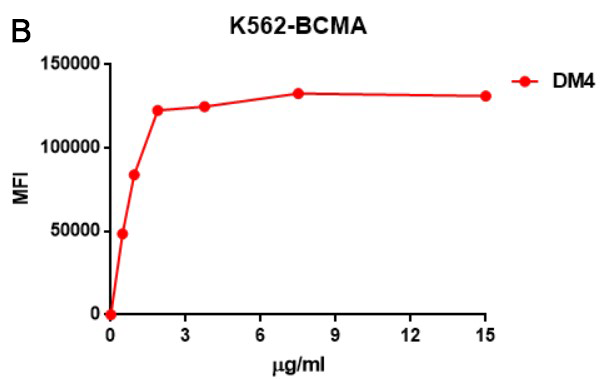
Figure 1. A. Flow cytometry analysis with BCMA ( DM4) on K562-BCMA (Red histogram) (K562 cells stably transduced by human BCMA full length gene) and K562 (Negative control cell line) (Blue histogram). B. Flow cytometry data of serially titrated BCMA ( DM4). The Y-axis represents the mean fluorescence intensity (MFI) while the X-axis represents the concentration of IgG used. | 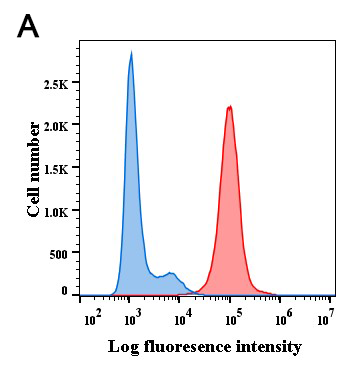 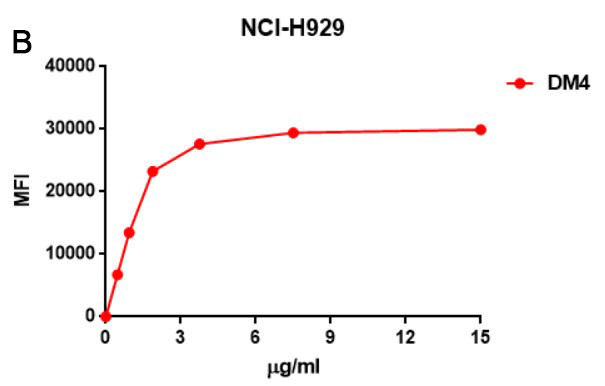
Figure 2. A. Flow cytometry analysis with BCMA ( DM4) on NCI-H929 cells (Red histogram) or rabbit control antibody on NCI-H929 cells (Blue histogram). B. Flow cytometry data of serially titrated BCMA ( DM4) on NCI-H929 cells. The Y-axis represents the mean fluorescence intensity (MFI) while the X-axis represents the concentration of IgG used. | 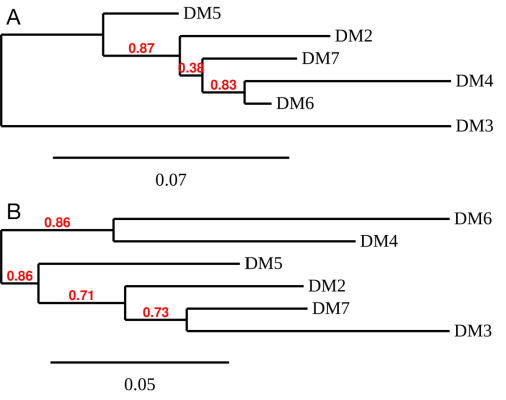
Figure 3. Phylogenetic analysis of different BCMA DimAb clones.A) heavy chain and B) Light chain. | 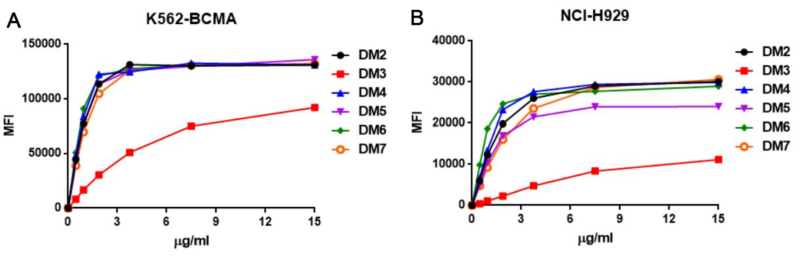
Figure 4. Affinity ranking of different DimAb clones by titration of rabbit DimAb antibody concentration onto K562-BCMA or NCI-H929 cells. Different concentrations of various BCMA DimAb clones were incubated with K562-BCMA ( A) or NCI-H929 cells ( B) at 4. Bound rabbit IgG was detected in flow cytometry analysis. The Y-axis represents the mean fluorescence intensity (MFI) while the X-axis represents the concentration of IgG used. | 
Figure 6. Immunoprecipitation analysis. Cellular overexpression lysates (made from HEK293F cells transfected with FLAG tagged human BCMA full length gene) were pre-incubated with 6 different rabbit DimAb clones and negative control IgG. The immunocomplexes were further pulled down by protein A beads, fractionated, and blotted with mouse FLAG monoclonal antibody. | 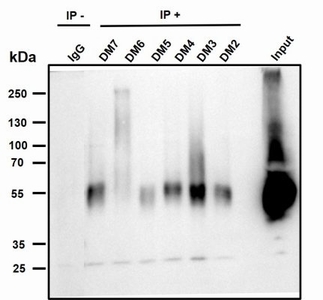
Figure 6. Immunoprecipitation analysis. Cellular overexpression lysates (made from HEK293F cells transfected with FLAG tagged human BCMA full length gene) were pre-incubated with 6 different rabbit DimAb clones and negative control IgG. The immunocomplexes were further pulled down by protein A beads, fractionated, and blotted with mouse FLAG monoclonal antibody. |
|